What’s captured
Workloads
The Workloads page lists every job that writes data, with its runs: Spark jobs, scheduled queries, lake writes such asINSERT, CREATE TABLE AS, or Save result, transfers, table maintenance, and anything an integration reports. Reads that only return rows are not listed.
Each workload shows the engine of its latest run and whether it is active, failing, or anomalous. A scheduled query is one workload, oleander.schedules/<destination table>, whichever engine runs it. Filter by Engine to list the workloads whose latest run, or a child job of it, ran on DuckDB, Polars, Bloom, or Spark, so an Airflow DAG whose tasks run on Spark is found under Spark.
The runs table shows each run’s Compute - the sandbox size, or the Spark executors - next to its cost.
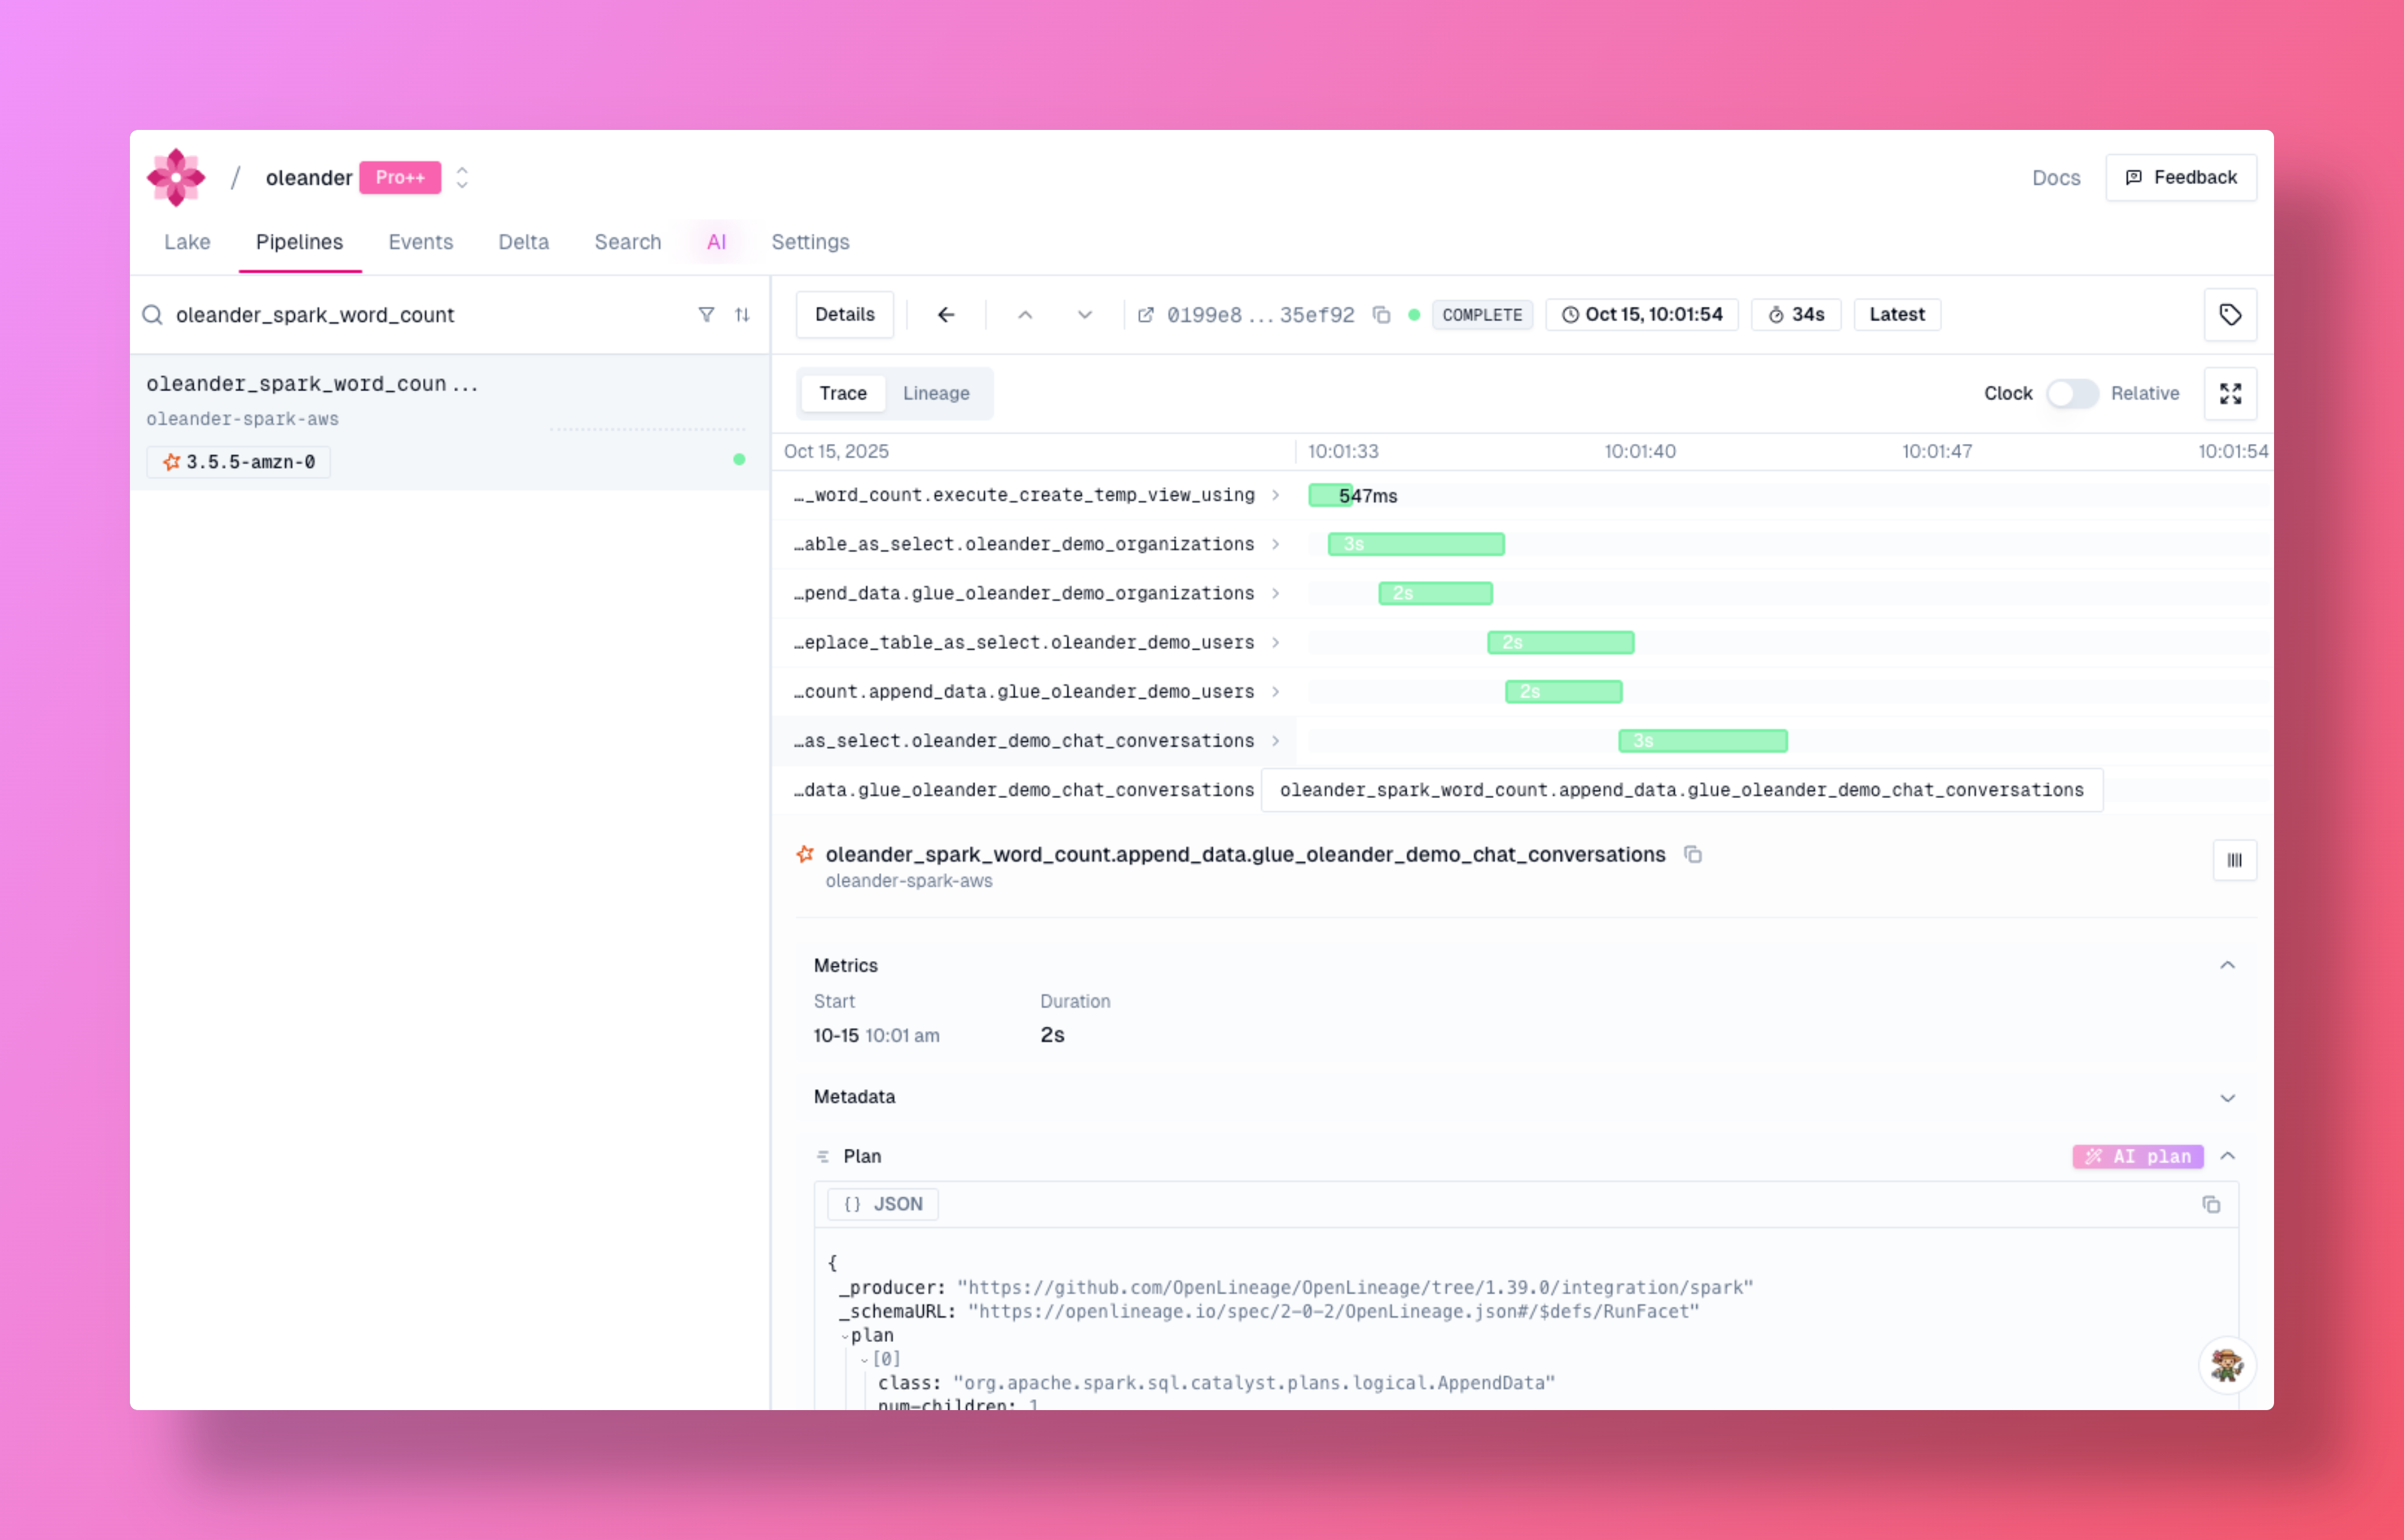
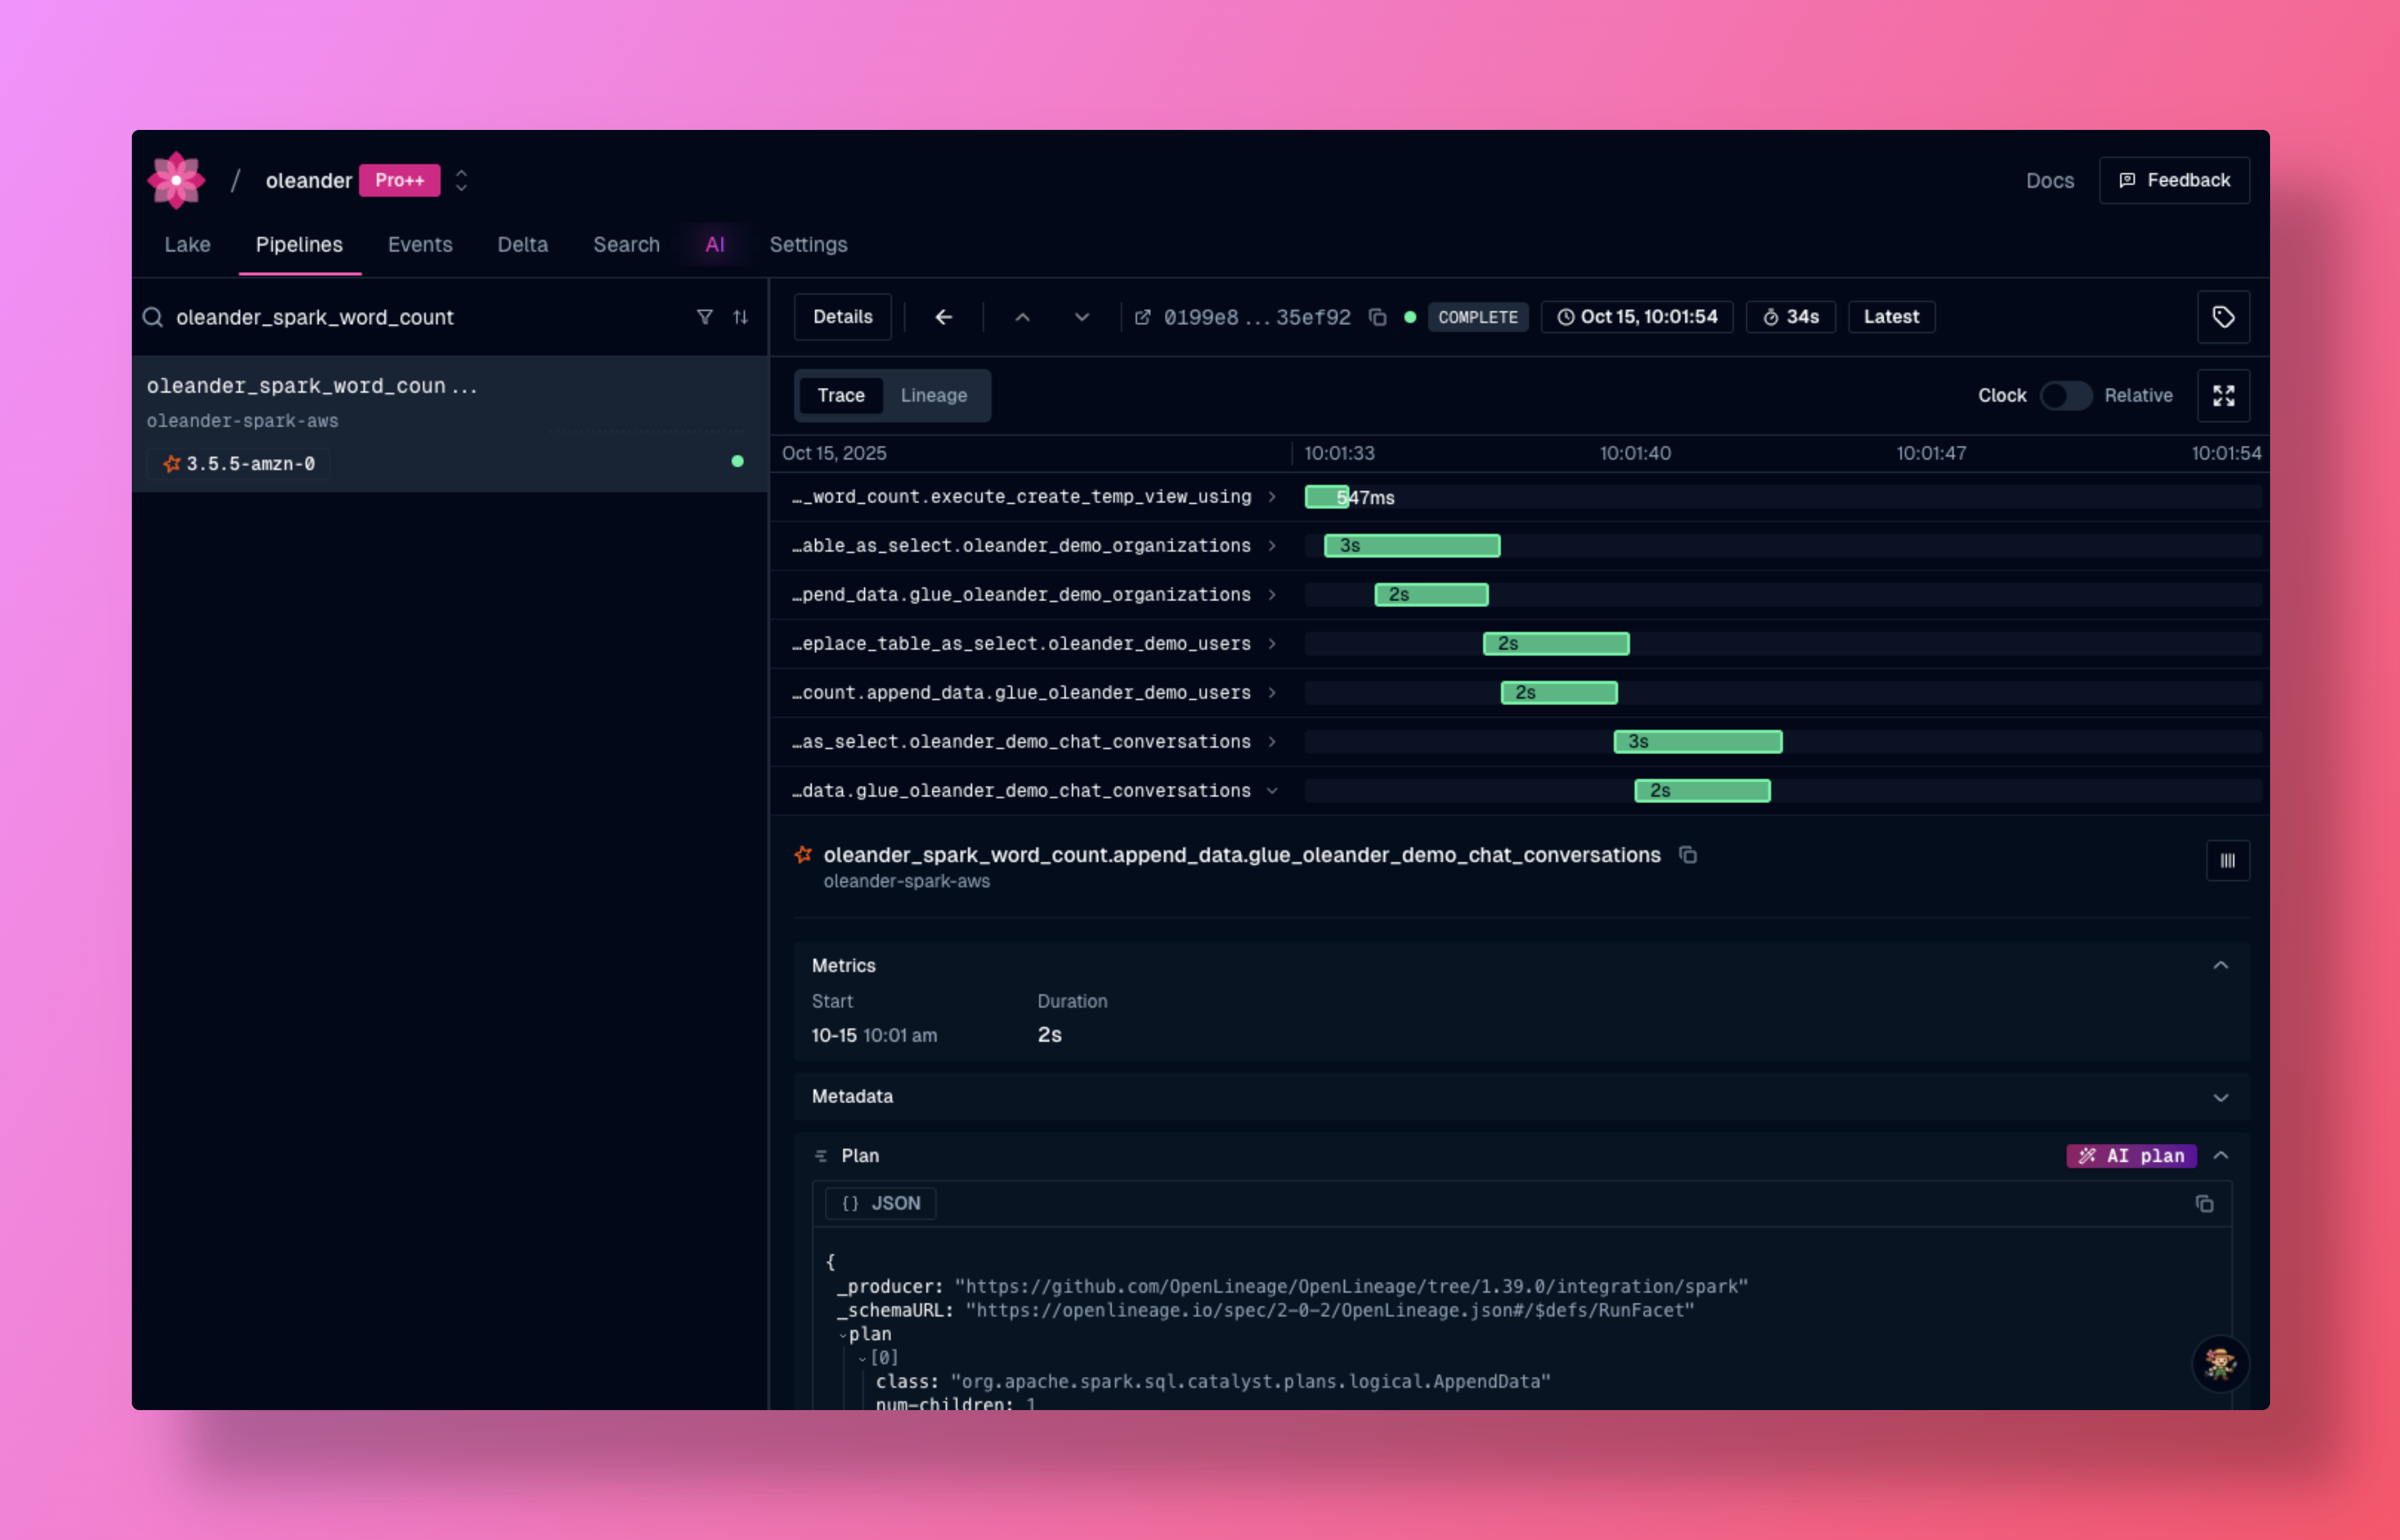
Select a run to see its Trace, Logs, Lineage, Column lineage, and Alerts. The trace nests each job under its parent on a shared timeline; click a job to open an inspector with its timeline and properties, SQL, inputs and outputs, spans, source code, plan, and logs, each shown only when the job has one. The lineage tabs open a context panel for the dataset or column you select.
Search
oleander indexes all lineage metadata and exposes a faceted search across jobs, datasets, and runs. Filter by job name, dataset, schema field, namespace, or run status to find exactly what you need.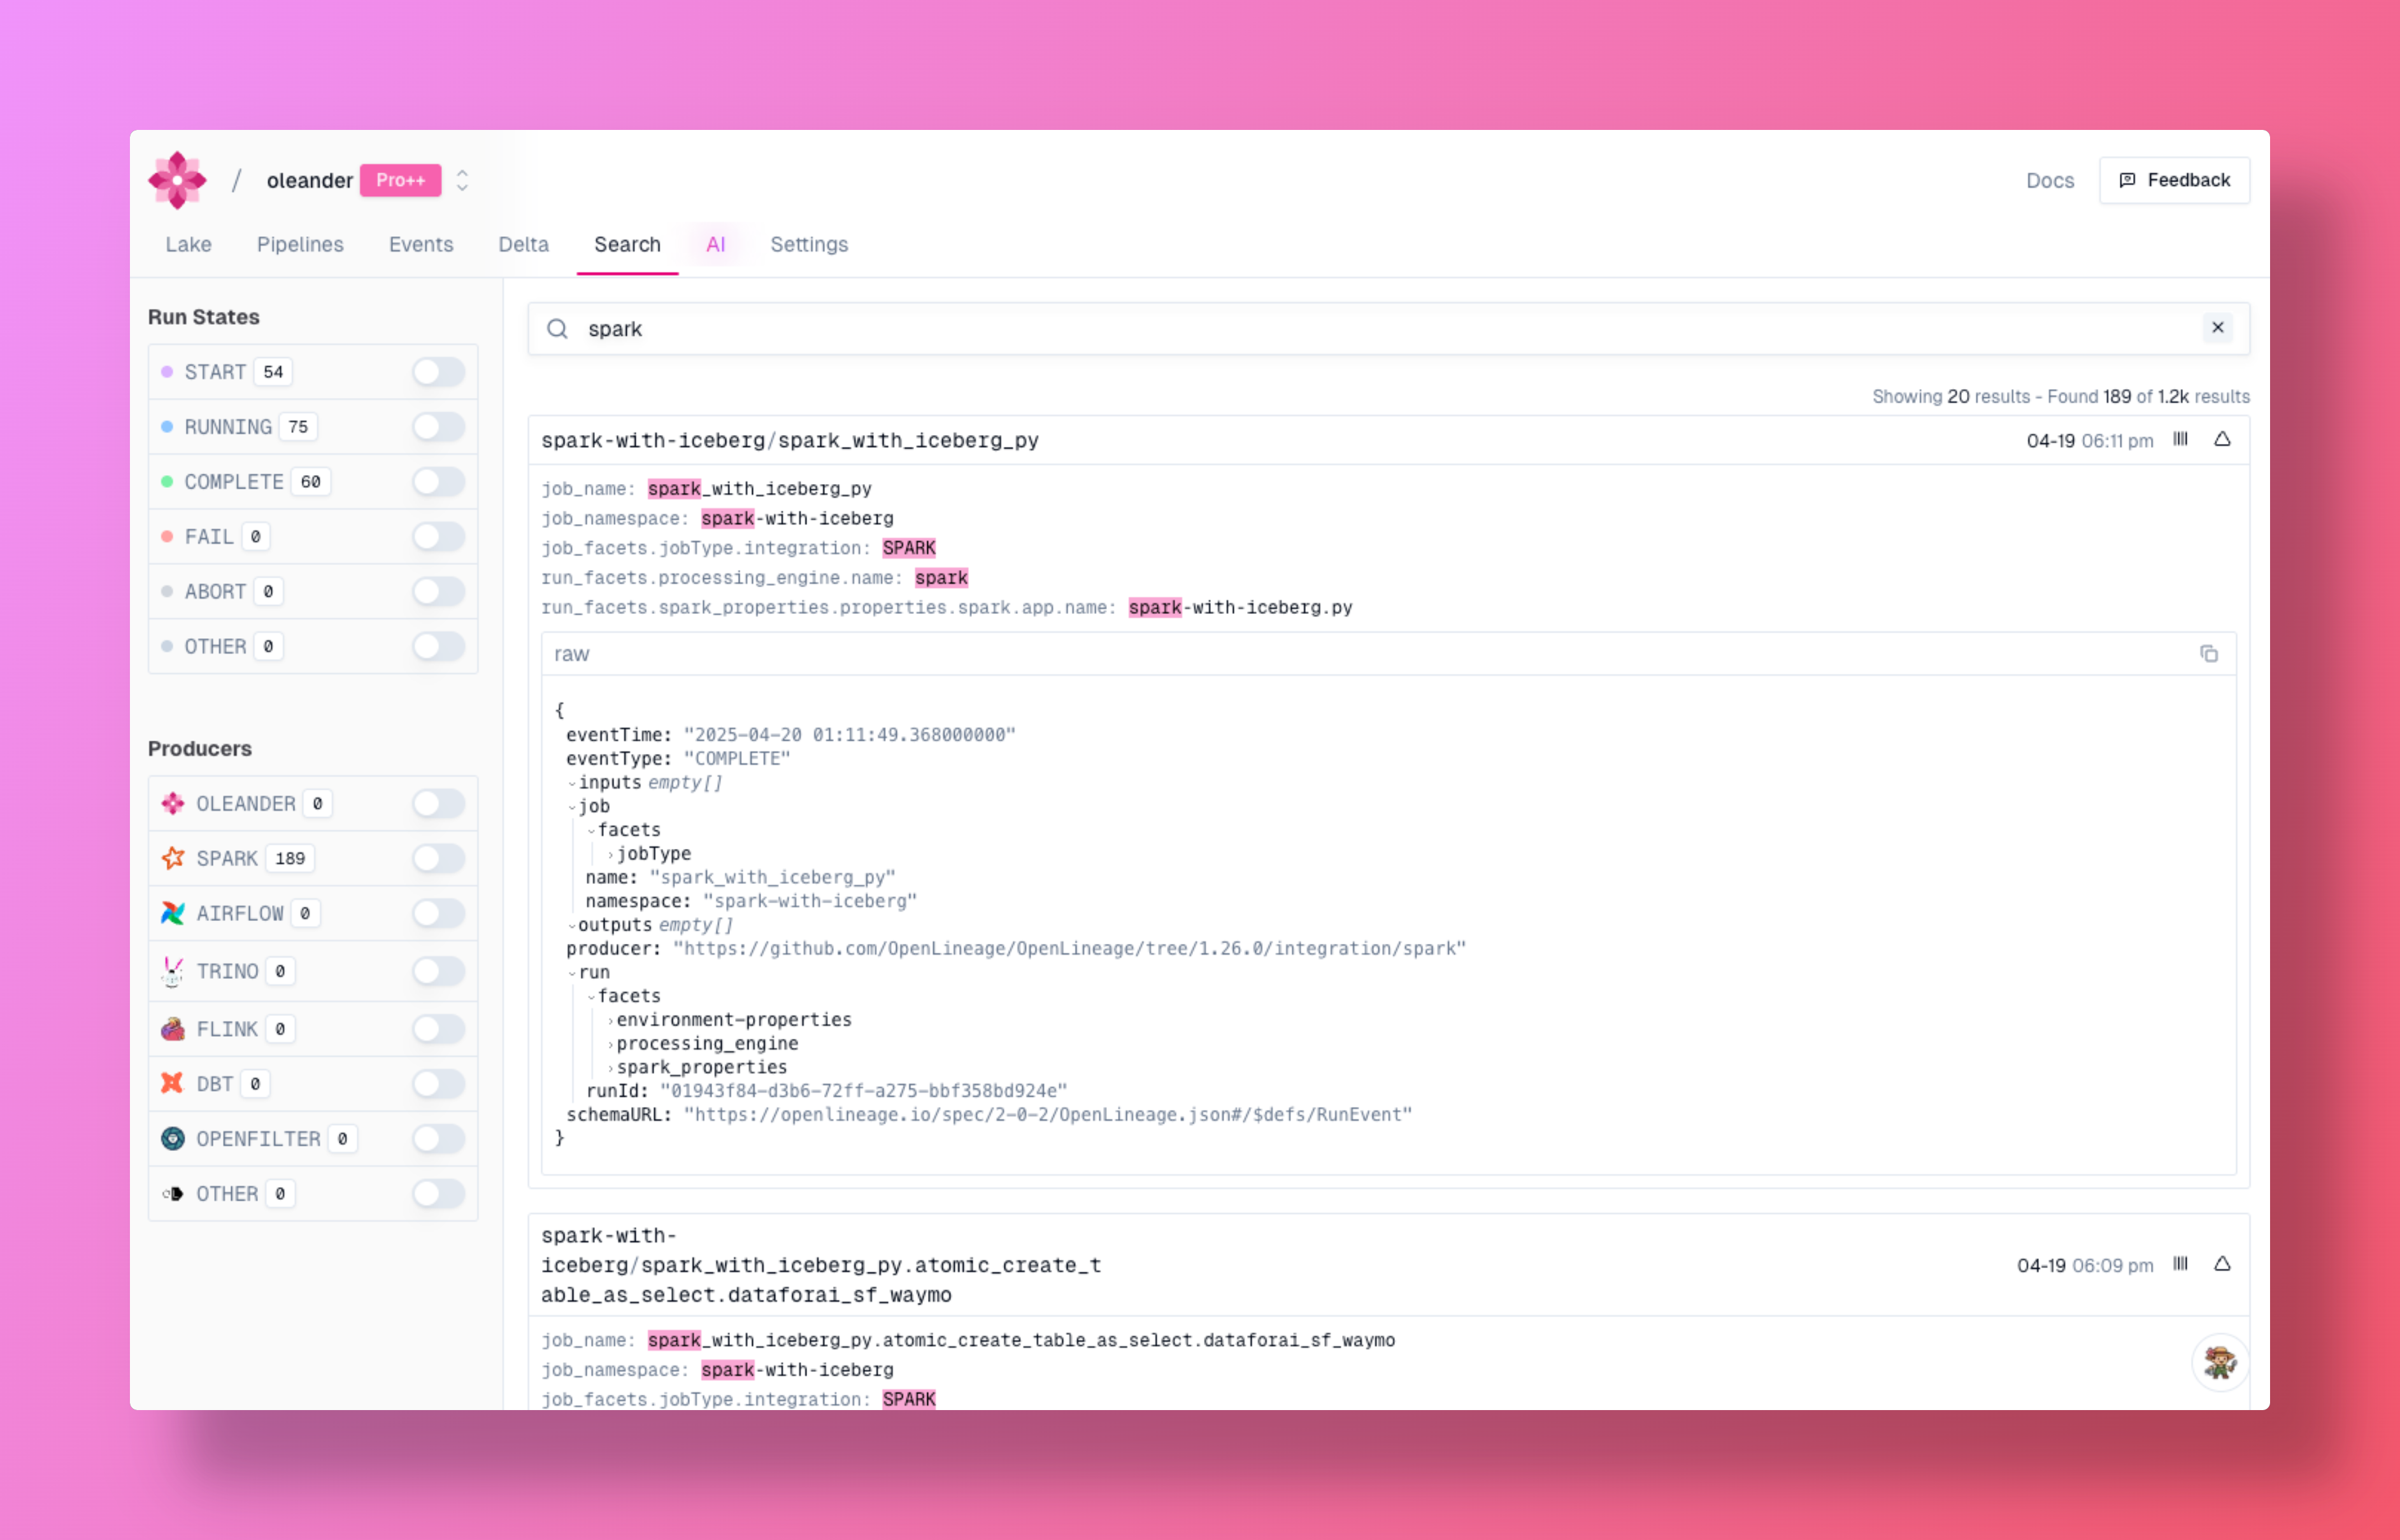
Chat
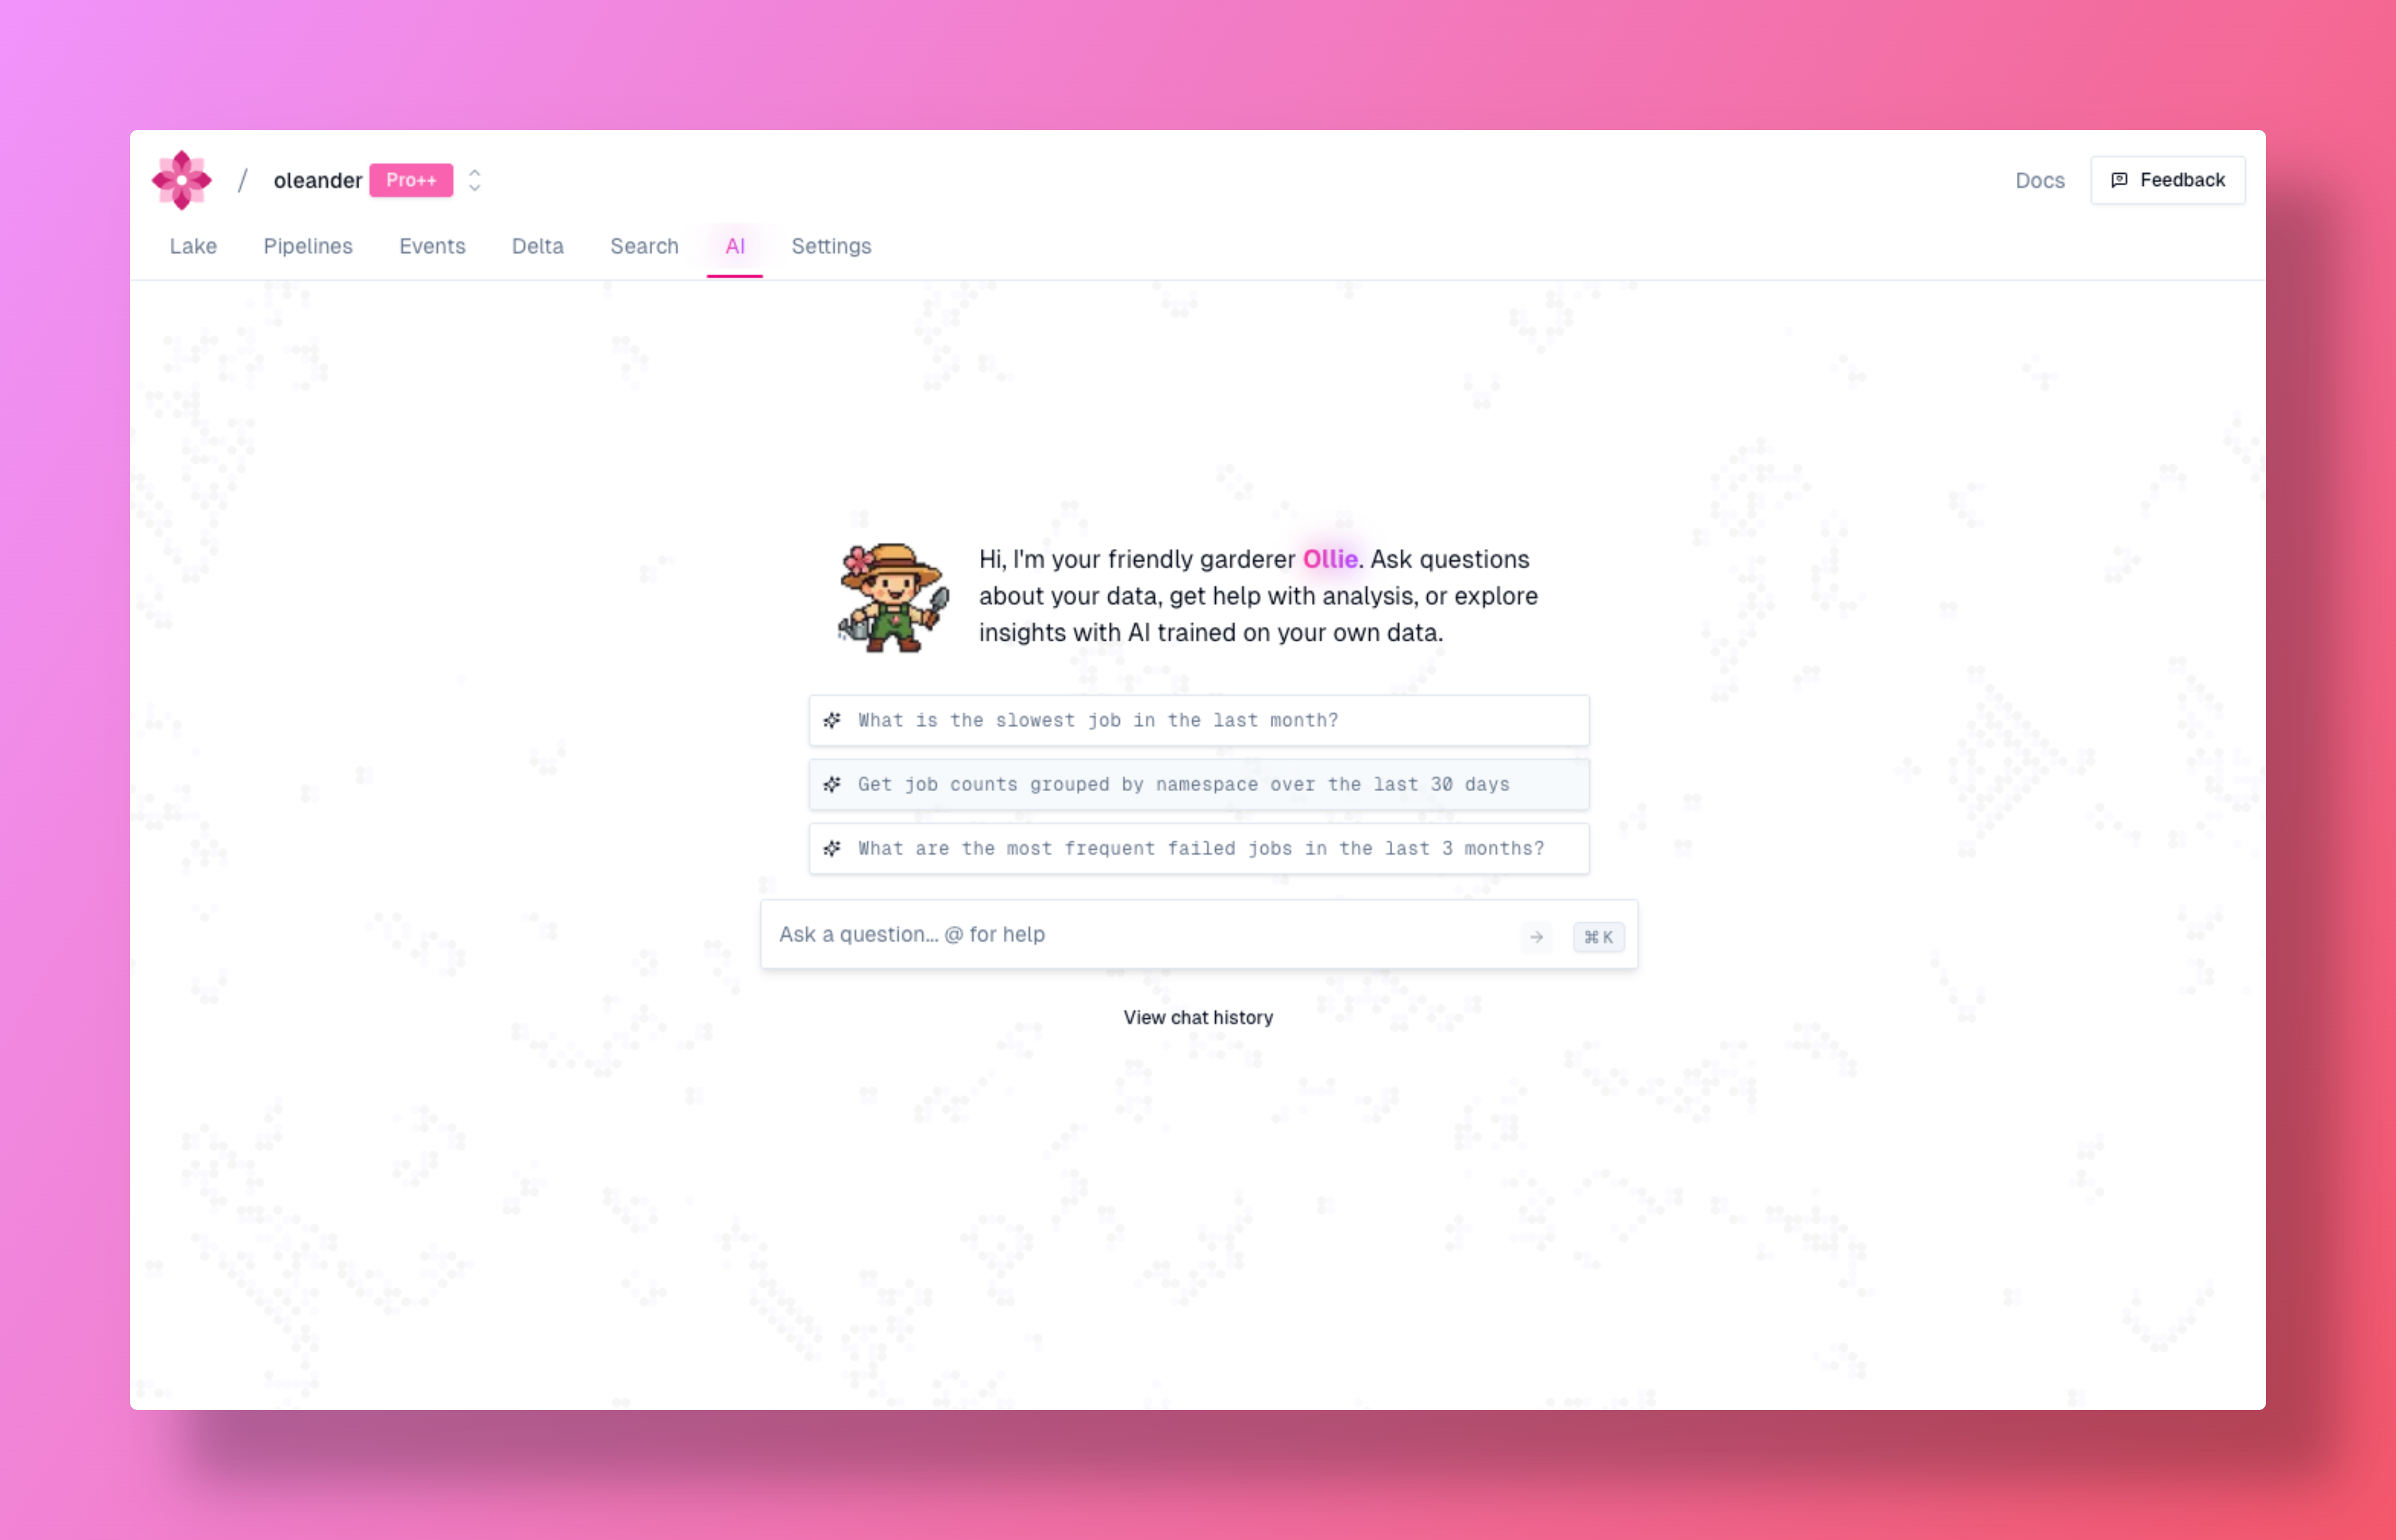
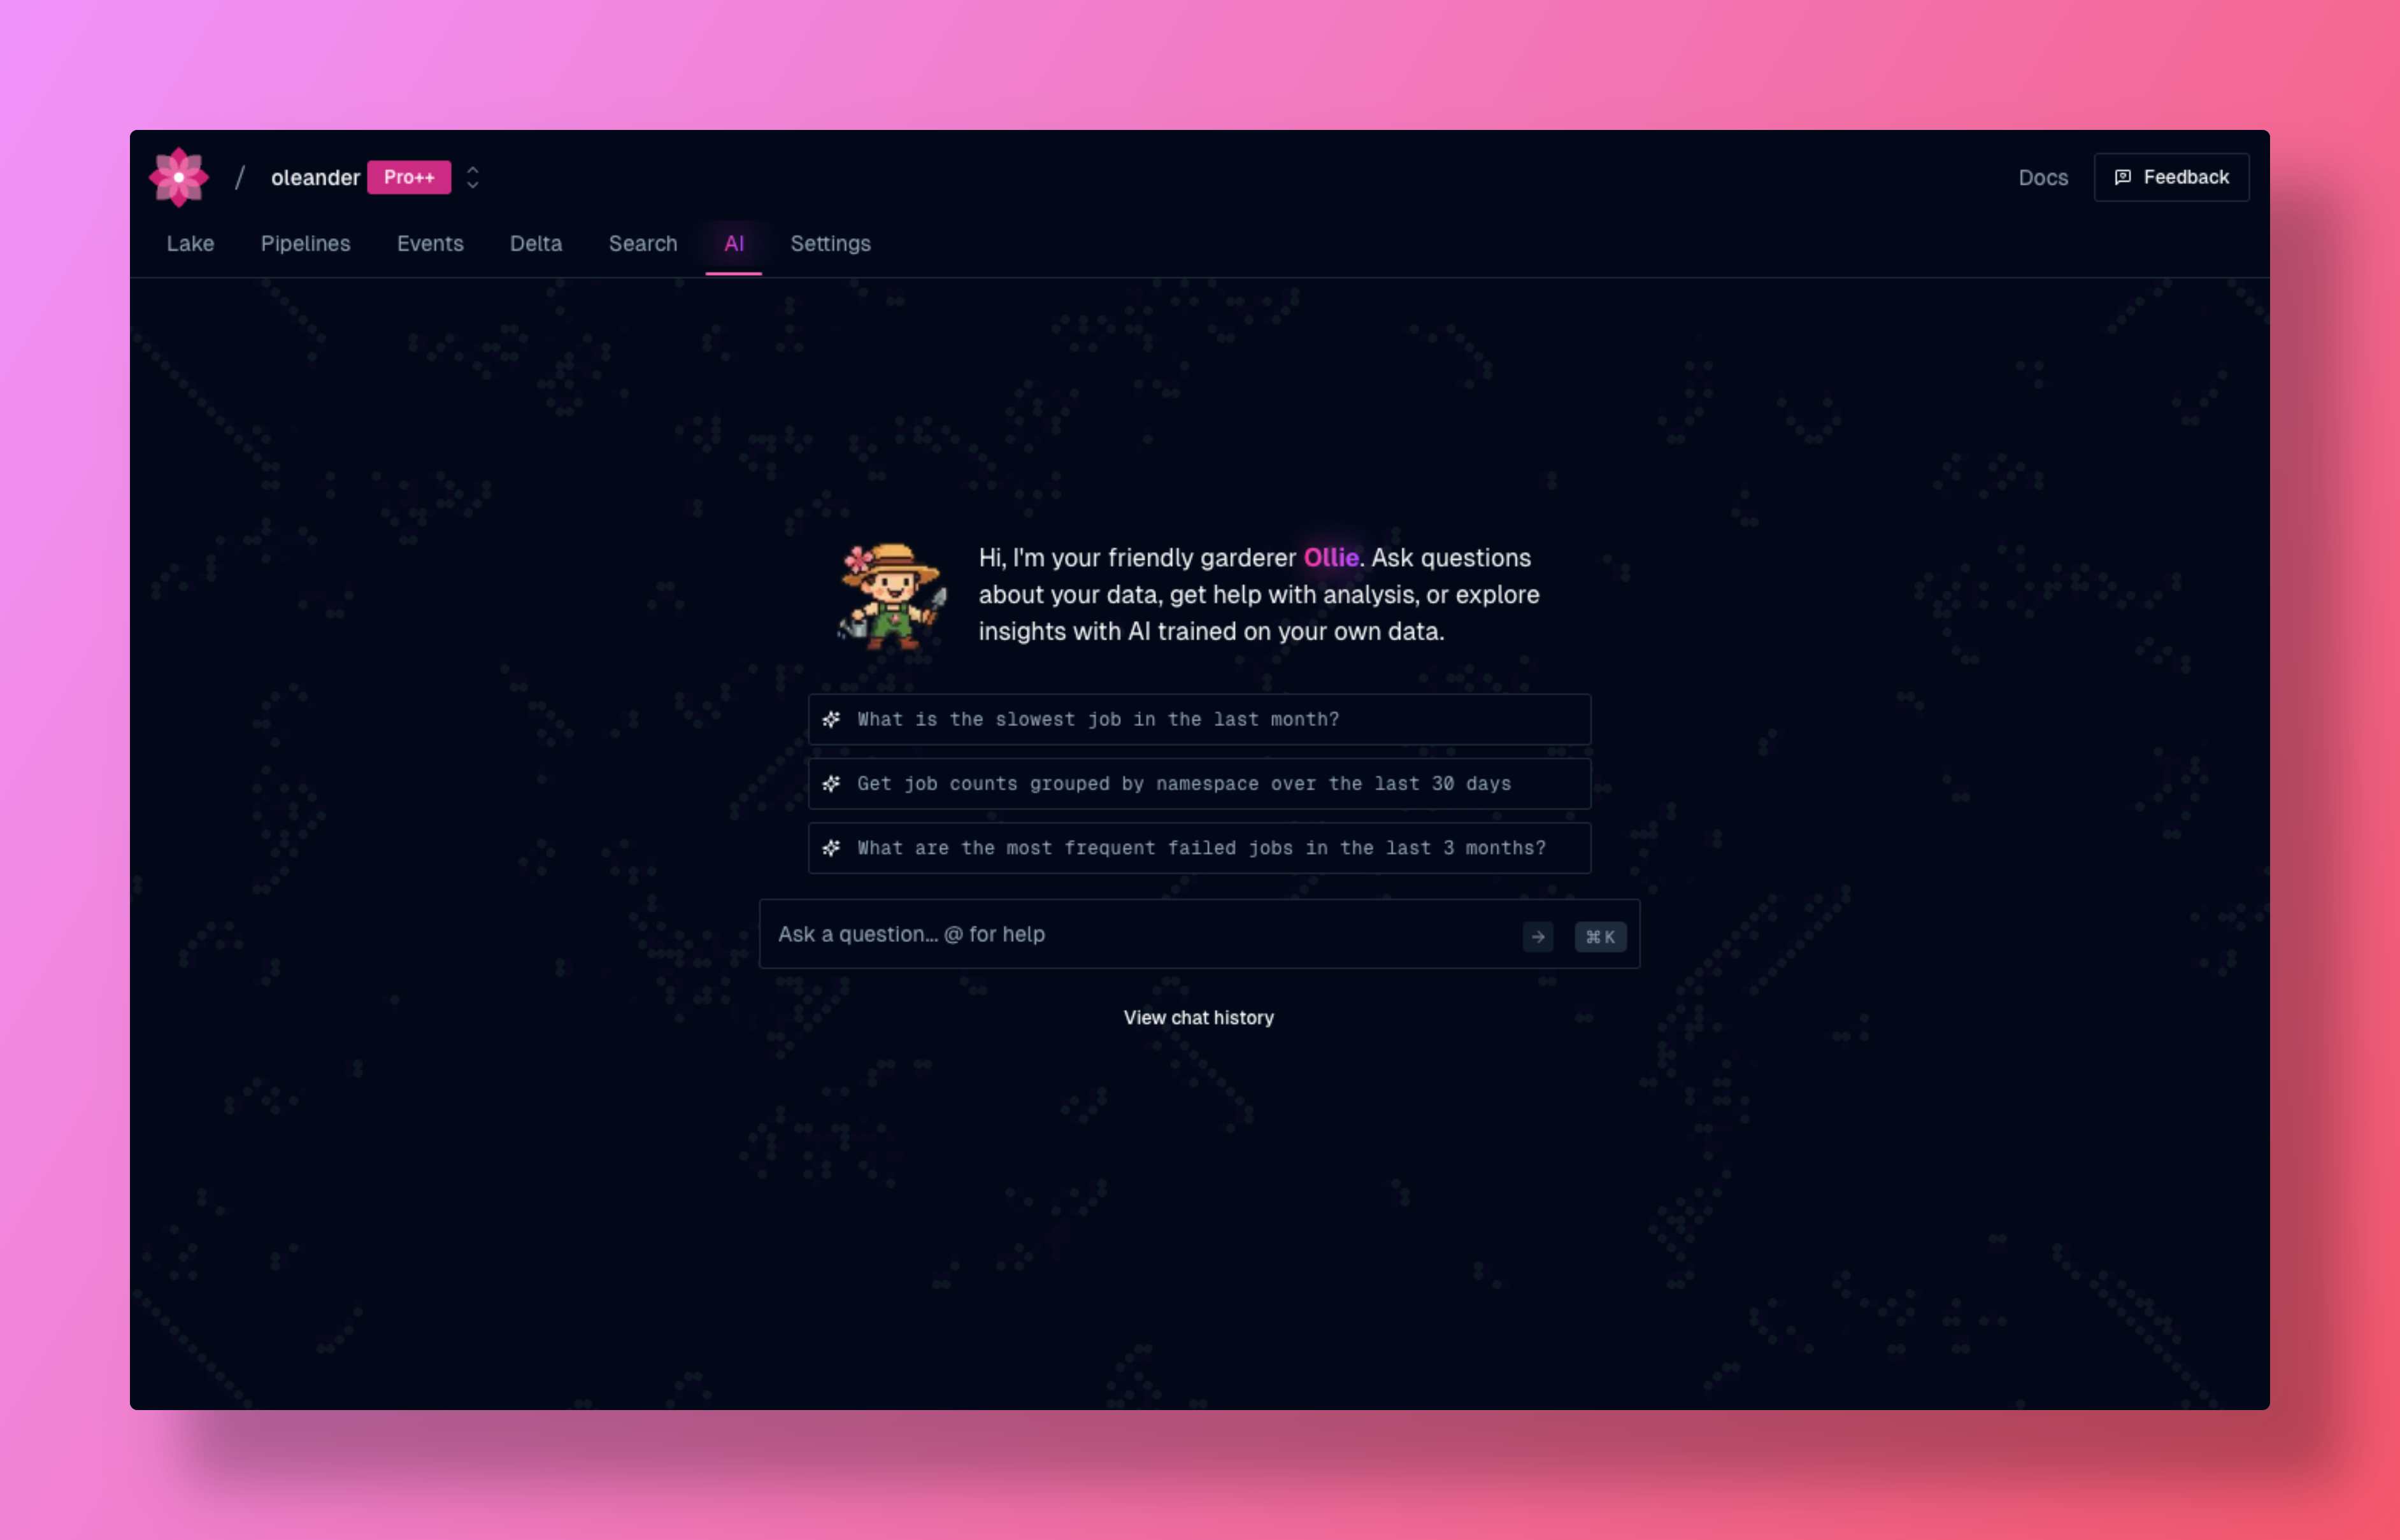
Ask Lea and Ollie - oleander’s assistants - questions about your pipelines in plain English. They can diagnose failures, trace impact, surface anomalies, and explain lineage without you having to navigate the graph manually. For programmatic access, see Coding with agents.