> ## Documentation Index
> Fetch the complete documentation index at: https://docs.oleander.dev/llms.txt
> Use this file to discover all available pages before exploring further.
# Catalogs
> Every organization gets a private Iceberg catalog with namespaces for user data and telemetry.
 ## Your private Iceberg catalog
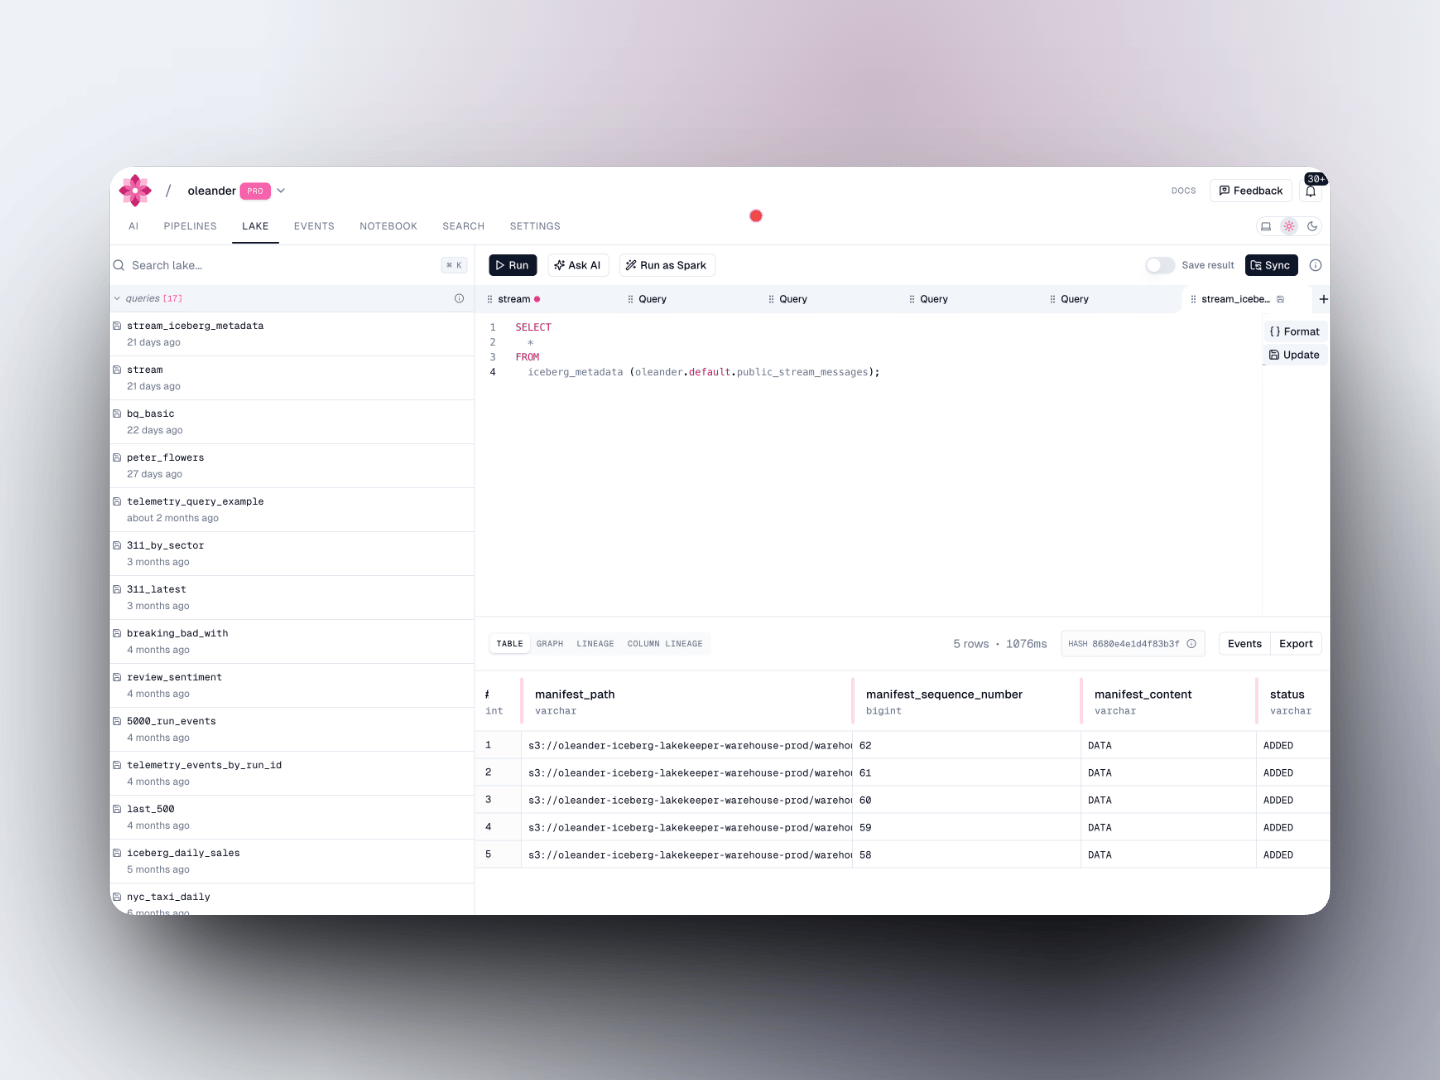
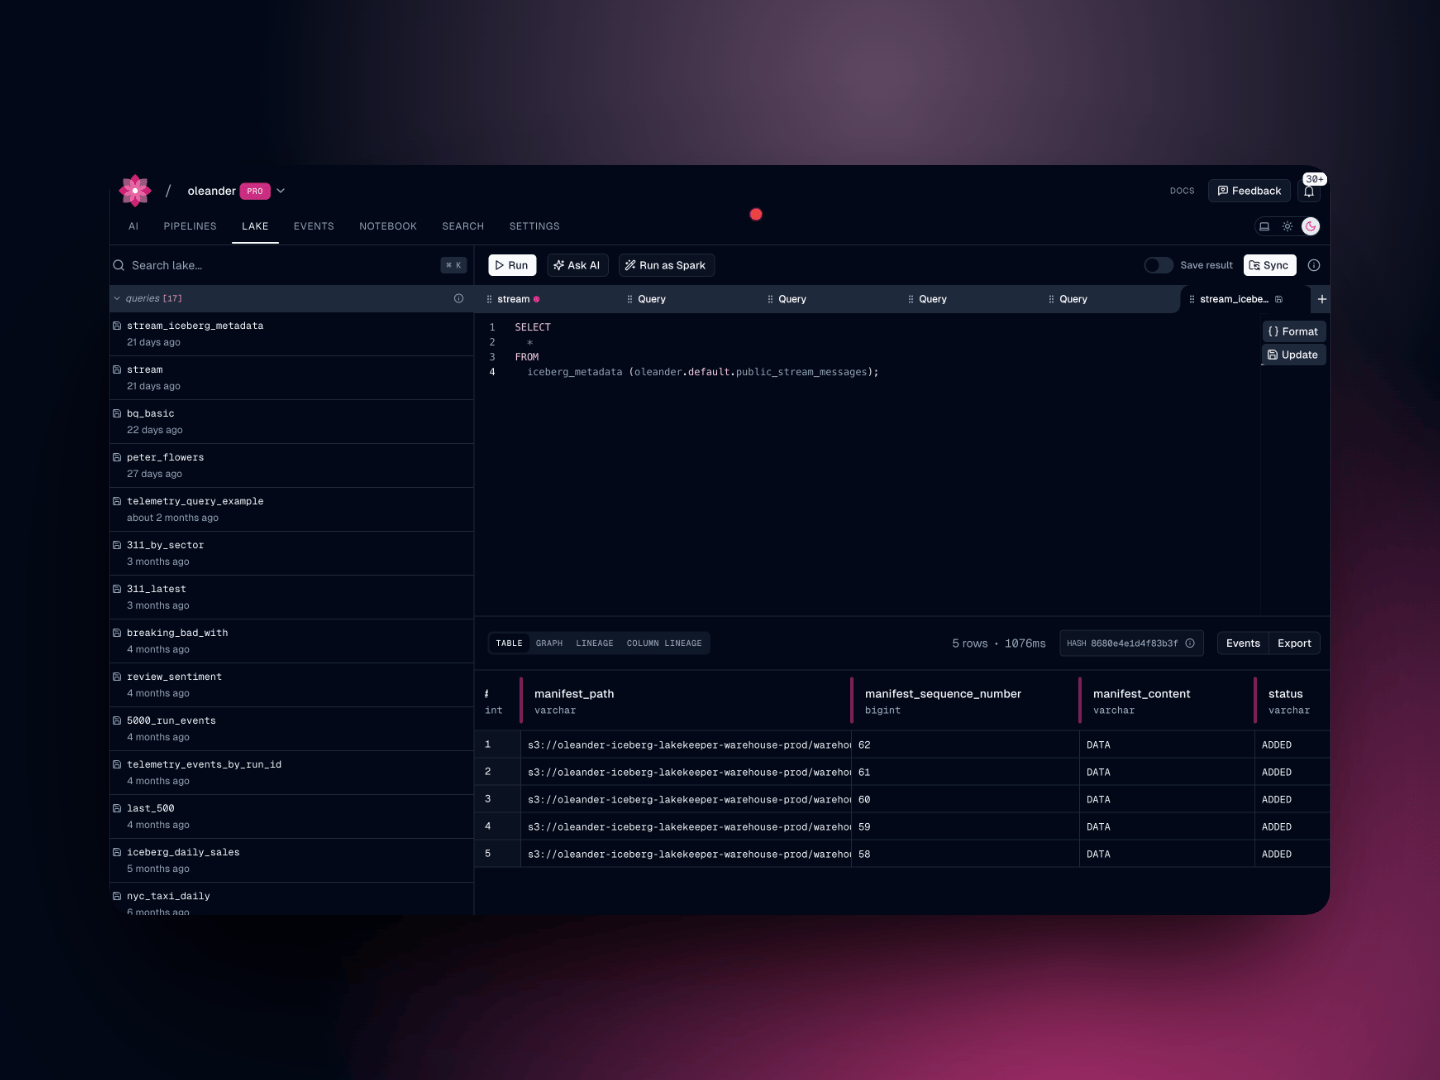
Every oleander organization is automatically provisioned a private **Apache Iceberg** catalog named `oleander`. It is backed by [Lakekeeper](https://lakekeeper.io/) and stored on S3, and it exposes a standard [Iceberg REST catalog](https://iceberg.apache.org/concepts/catalog/) endpoint, making it natively compatible with Spark, DuckDB, and any other Iceberg-aware tool.
The catalog contains two namespaces out of the box:
| Namespace | Purpose |
| ----------- | ---------------------------------------------------- |
| `default` | Your own tables, created via SQL, upload, or S3 sync |
| `telemetry` | Platform events written automatically by oleander |
Reference any table in your queries with the three-part identifier:
```sql theme={null}
SELECT * FROM oleander.. LIMIT 100;
```
## Telemetry namespace
The `telemetry` namespace is populated automatically as your pipelines run. It contains three tables:
### `oleander.telemetry.run_events`
OpenLineage run lifecycle events (START, COMPLETE, FAIL, etc.) for every job execution. Partitioned by `event_time`.
| Column | Type | Description |
| -------------------------- | --------- | -------------------------------- |
| `event_type` | string | START, COMPLETE, FAIL, ABORT |
| `event_time` | timestamp | When the event occurred |
| `received_at` | timestamp | When oleander received the event |
| `telemetry_correlation_id` | string | Correlation ID |
| `run` | struct | Run ID and facets |
| `job` | struct | Job namespace and name |
| `inputs` | list | Input datasets |
| `outputs` | list | Output datasets |
```sql theme={null}
-- Recent failures across all jobs
SELECT
job.namespace,
job.name,
run.runId,
event_time
FROM oleander.telemetry.run_events
WHERE event_type = 'FAIL'
AND event_time >= TIMESTAMP '2024-06-01 00:00:00'
ORDER BY event_time DESC
LIMIT 25;
-- Failure rate by job over the last 7 days
SELECT
job.name,
COUNT(*) FILTER (WHERE event_type = 'FAIL') AS failures,
COUNT(*) FILTER (WHERE event_type = 'COMPLETE') AS successes,
ROUND(100.0 * COUNT(*) FILTER (WHERE event_type = 'FAIL') / COUNT(*), 1) AS failure_pct
FROM oleander.telemetry.run_events
WHERE event_time >= TIMESTAMP '2024-05-25 00:00:00'
AND event_type IN ('FAIL', 'COMPLETE')
GROUP BY job.name
ORDER BY failure_pct DESC;
```
### `oleander.telemetry.traces`
OpenTelemetry spans from your pipelines and tasks. Partitioned by `start_time`.
| Column | Type | Description |
| ------------------------- | --------- | -------------------------------- |
| `trace_id` | string | OTel trace ID |
| `span_id` | string | OTel span ID |
| `parent_span_id` | string | Parent span ID |
| `span_name` | string | Span name |
| `span_kind` | string | CLIENT, SERVER, INTERNAL, etc. |
| `start_time` / `end_time` | timestamp | Span timing |
| `status_code` | string | OK, ERROR, UNSET |
| `span_attributes` | string | JSON-encoded span attributes |
| `resource_attributes` | string | JSON-encoded resource attributes |
```sql theme={null}
-- Slowest spans for a trace
SELECT
span_name,
DATEDIFF('millisecond', start_time, end_time) AS duration_ms,
status_code
FROM oleander.telemetry.traces
WHERE trace_id = ''
AND start_time >= TIMESTAMP '2024-06-01 00:00:00'
ORDER BY duration_ms DESC;
```
### `oleander.telemetry.logs`
Log records emitted by your pipelines. Partitioned by `time`.
| Column | Type | Description |
| ---------------------- | --------- | -------------------------------- |
| `time` | timestamp | Log record timestamp |
| `severity` | string | DEBUG, INFO, WARN, ERROR |
| `trace_id` / `span_id` | string | Correlated trace context |
| `body` | string | Log message body |
| `log_attributes` | string | JSON-encoded log attributes |
| `resource_attributes` | string | JSON-encoded resource attributes |
```sql theme={null}
-- Error logs for a specific correlation ID
SELECT time, severity, body
FROM oleander.telemetry.logs
WHERE trace_id = ''
AND severity IN ('ERROR', 'WARN')
AND time >= TIMESTAMP '2024-06-01 00:00:00'
ORDER BY time DESC;
```
## Spark compatibility
Because `oleander` is a standard Iceberg REST catalog, you can attach it directly in a Spark session. See the [Spark integration guide](/integrations/spark) for full configuration.
```python theme={null}
spark = SparkSession.builder \
.config("spark.sql.catalog.oleander", "org.apache.iceberg.spark.SparkCatalog") \
.config("spark.sql.catalog.oleander.type", "rest") \
.config("spark.sql.catalog.oleander.uri", "") \
.config("spark.sql.catalog.oleander.credential", "") \
.getOrCreate()
spark.sql("SELECT * FROM oleander.telemetry.run_events LIMIT 10").show()
```
Your catalog URI and credentials are available in [lake settings](https://oleander.dev/app/settings/lake).
## Bring your own catalog
In addition to your private catalog, you can register an external [AWS S3 Tables](https://docs.aws.amazon.com/AmazonS3/latest/userguide/s3-tables.html) catalog and query it alongside your own data. See the [Query](/platform/lake/query#bring-your-own-iceberg-catalog) guide for setup instructions.
## Your private Iceberg catalog
Every oleander organization is automatically provisioned a private **Apache Iceberg** catalog named `oleander`. It is backed by [Lakekeeper](https://lakekeeper.io/) and stored on S3, and it exposes a standard [Iceberg REST catalog](https://iceberg.apache.org/concepts/catalog/) endpoint, making it natively compatible with Spark, DuckDB, and any other Iceberg-aware tool.
The catalog contains two namespaces out of the box:
| Namespace | Purpose |
| ----------- | ---------------------------------------------------- |
| `default` | Your own tables, created via SQL, upload, or S3 sync |
| `telemetry` | Platform events written automatically by oleander |
Reference any table in your queries with the three-part identifier:
```sql theme={null}
SELECT * FROM oleander.. LIMIT 100;
```
## Telemetry namespace
The `telemetry` namespace is populated automatically as your pipelines run. It contains three tables:
### `oleander.telemetry.run_events`
OpenLineage run lifecycle events (START, COMPLETE, FAIL, etc.) for every job execution. Partitioned by `event_time`.
| Column | Type | Description |
| -------------------------- | --------- | -------------------------------- |
| `event_type` | string | START, COMPLETE, FAIL, ABORT |
| `event_time` | timestamp | When the event occurred |
| `received_at` | timestamp | When oleander received the event |
| `telemetry_correlation_id` | string | Correlation ID |
| `run` | struct | Run ID and facets |
| `job` | struct | Job namespace and name |
| `inputs` | list | Input datasets |
| `outputs` | list | Output datasets |
```sql theme={null}
-- Recent failures across all jobs
SELECT
job.namespace,
job.name,
run.runId,
event_time
FROM oleander.telemetry.run_events
WHERE event_type = 'FAIL'
AND event_time >= TIMESTAMP '2024-06-01 00:00:00'
ORDER BY event_time DESC
LIMIT 25;
-- Failure rate by job over the last 7 days
SELECT
job.name,
COUNT(*) FILTER (WHERE event_type = 'FAIL') AS failures,
COUNT(*) FILTER (WHERE event_type = 'COMPLETE') AS successes,
ROUND(100.0 * COUNT(*) FILTER (WHERE event_type = 'FAIL') / COUNT(*), 1) AS failure_pct
FROM oleander.telemetry.run_events
WHERE event_time >= TIMESTAMP '2024-05-25 00:00:00'
AND event_type IN ('FAIL', 'COMPLETE')
GROUP BY job.name
ORDER BY failure_pct DESC;
```
### `oleander.telemetry.traces`
OpenTelemetry spans from your pipelines and tasks. Partitioned by `start_time`.
| Column | Type | Description |
| ------------------------- | --------- | -------------------------------- |
| `trace_id` | string | OTel trace ID |
| `span_id` | string | OTel span ID |
| `parent_span_id` | string | Parent span ID |
| `span_name` | string | Span name |
| `span_kind` | string | CLIENT, SERVER, INTERNAL, etc. |
| `start_time` / `end_time` | timestamp | Span timing |
| `status_code` | string | OK, ERROR, UNSET |
| `span_attributes` | string | JSON-encoded span attributes |
| `resource_attributes` | string | JSON-encoded resource attributes |
```sql theme={null}
-- Slowest spans for a trace
SELECT
span_name,
DATEDIFF('millisecond', start_time, end_time) AS duration_ms,
status_code
FROM oleander.telemetry.traces
WHERE trace_id = ''
AND start_time >= TIMESTAMP '2024-06-01 00:00:00'
ORDER BY duration_ms DESC;
```
### `oleander.telemetry.logs`
Log records emitted by your pipelines. Partitioned by `time`.
| Column | Type | Description |
| ---------------------- | --------- | -------------------------------- |
| `time` | timestamp | Log record timestamp |
| `severity` | string | DEBUG, INFO, WARN, ERROR |
| `trace_id` / `span_id` | string | Correlated trace context |
| `body` | string | Log message body |
| `log_attributes` | string | JSON-encoded log attributes |
| `resource_attributes` | string | JSON-encoded resource attributes |
```sql theme={null}
-- Error logs for a specific correlation ID
SELECT time, severity, body
FROM oleander.telemetry.logs
WHERE trace_id = ''
AND severity IN ('ERROR', 'WARN')
AND time >= TIMESTAMP '2024-06-01 00:00:00'
ORDER BY time DESC;
```
## Spark compatibility
Because `oleander` is a standard Iceberg REST catalog, you can attach it directly in a Spark session. See the [Spark integration guide](/integrations/spark) for full configuration.
```python theme={null}
spark = SparkSession.builder \
.config("spark.sql.catalog.oleander", "org.apache.iceberg.spark.SparkCatalog") \
.config("spark.sql.catalog.oleander.type", "rest") \
.config("spark.sql.catalog.oleander.uri", "") \
.config("spark.sql.catalog.oleander.credential", "") \
.getOrCreate()
spark.sql("SELECT * FROM oleander.telemetry.run_events LIMIT 10").show()
```
Your catalog URI and credentials are available in [lake settings](https://oleander.dev/app/settings/lake).
## Bring your own catalog
In addition to your private catalog, you can register an external [AWS S3 Tables](https://docs.aws.amazon.com/AmazonS3/latest/userguide/s3-tables.html) catalog and query it alongside your own data. See the [Query](/platform/lake/query#bring-your-own-iceberg-catalog) guide for setup instructions.